量化之路(一):搭建回测框架 backtrader
搭建 backtrader 量化框架
安装 Backtrader 库:
pip install backtrader如果需要绘图的话,还要安装 matplotlib 库,否则调用 cerebro.plot() 函数时会报错。另外,backtrader 与 matplotlib 3.3以上版本不兼容,如果以前安装过 3.3 版本的话,需要卸载并安装 3.2 版本:
pip uninstall matplotlib
pip install matplotlib==3.2.2
那么,量化框架就搭好了。
backtrader 的运行流程
制定策略
- 确定潜在的可调参数
- 实例化您在策略中需要的指标
- 写下进入/退出市场的逻辑
创建Cerebro引擎(西班牙语大脑的意思)
- 注入策略
- 使用cerebro.adddata加载回测数据
- 执行cerebro.run
- 使用cerebro.plot绘制可视化图表
backtrader 简单应用
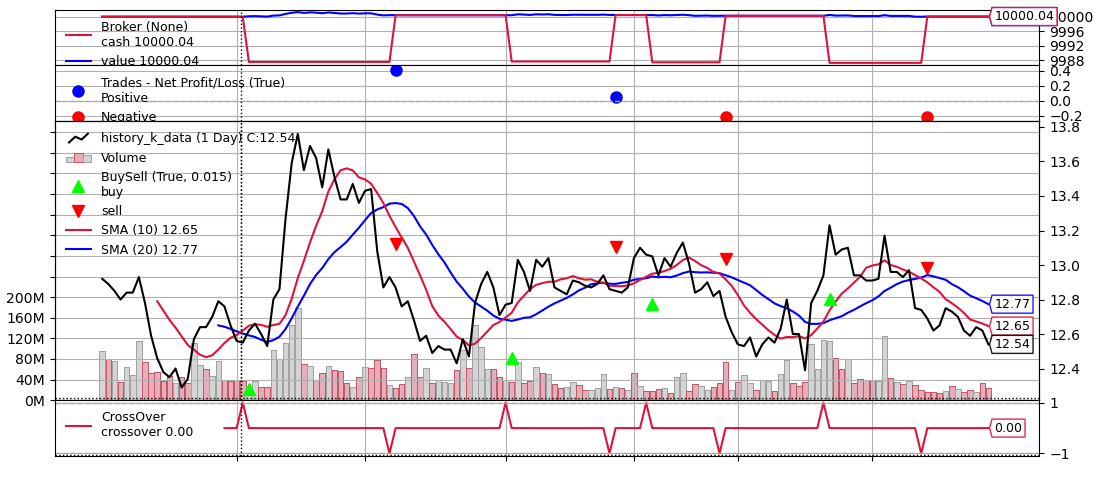
OK,按照上面的流程,我们来做一个简单的回测。下面的代码是直接抄自 backtrader 官网的 Hello Algotrading! 然后我唯一的改动就是把 data feed 的获取方式从原本是通过调用 yahoo API 在线获取改成了读取本地 csv 数据(样本数据见文末附件)。
from datetime import datetime
import backtrader as bt
# Create a subclass of Strategy to define the indicators and logic
class SmaCross(bt.Strategy):
# list of parameters which are configurable for the strategy
params = dict(
pfast=10, # period for the fast moving average
pslow=20 # period for the slow moving average
)
def __init__(self):
sma1 = bt.ind.SMA(period=self.p.pfast) # fast moving average
sma2 = bt.ind.SMA(period=self.p.pslow) # slow moving average
self.crossover = bt.ind.CrossOver(sma1, sma2) # crossover signal
def next(self):
if not self.position: # not in the market
if self.crossover > 0: # if fast crosses slow to the upside
self.buy() # enter long
elif self.crossover < 0: # in the market & cross to the downside
self.close() # close long position
cerebro = bt.Cerebro() # create a "Cerebro" engine instance
# Create a data feed,这里我改成了获取本地数据
# data = bt.feeds.YahooFinanceData(dataname='MSFT', fromdate=datetime(2011, 1, 1), todate=datetime(2012, 12, 31))
data = bt.feeds.GenericCSVData(
dataname='history_k_data.csv',
datetime=0, # 日期字段位置
open=2, # 开盘价
high=3, # 最高价
low=4, # 最低价
close=5, # 收盘价
volume=7, # 成交量
dtformat=('%Y-%m-%d'), # 定义日期格式
fromdate=datetime(2017, 6, 1), # 起始时间
todate=datetime(2017, 12, 29) # 结束时间
)
cerebro.adddata(data) # Add the data feed
cerebro.addstrategy(SmaCross) # Add the trading strategy
cerebro.run() # run it all
cerebro.plot() # and plot it with a single command执行结果:
通过回测图形可以看到,忙活了大半年居然赚了 0.04 元。
本作品采用 知识共享署名-相同方式共享 4.0 国际许可协议 进行许可。
 非正常程序员
在网上找到另一个方法,可以不用回滚到 matplotlib 3.2.2 版本。
https://blog.csdn.net/m0_65167078/article/details/121942610